Data Quality Visualization
Once you add a data quality data type to your Data Object class, the score computed for your Data Objects is visible:
- in the Data Object editor,
- in the Data Object grid,
- in the Data Object tree (depending on configuration).
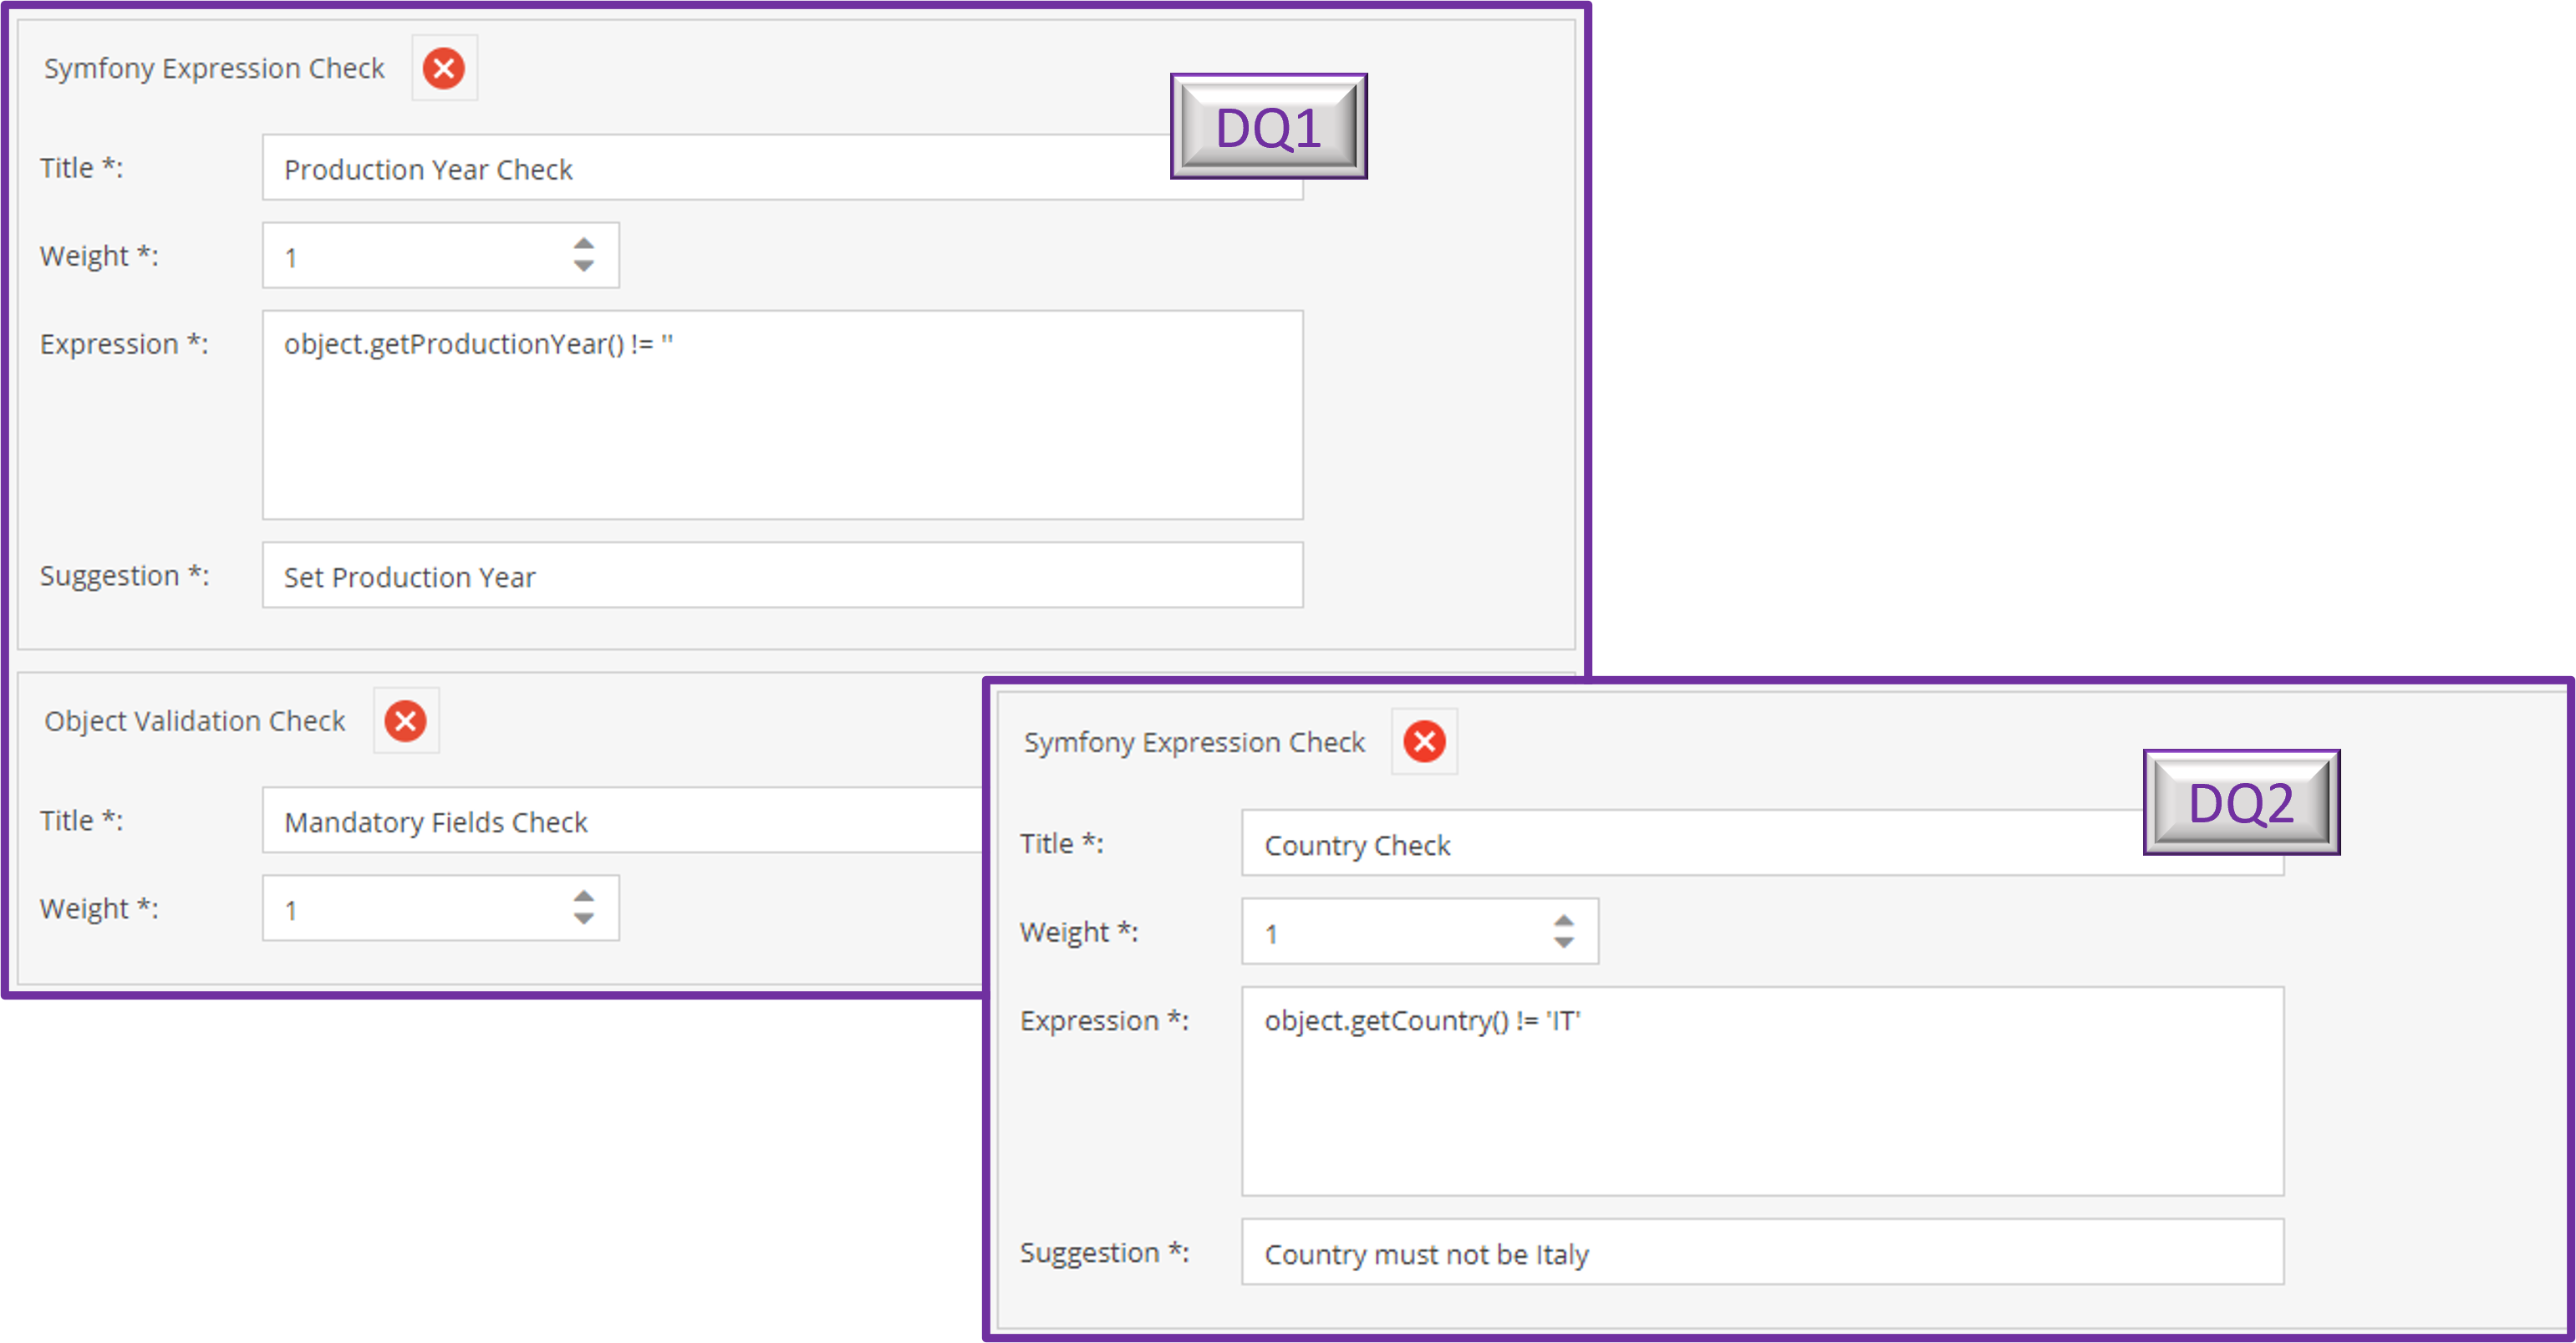
The data quality data types used for the given samples in the next sections are the following:
-
DQ1: Checks if all the mandatory fields (for this sample, the Data Object's name and description) and theProduction Yearfield are filled. -
DQ2: Checks that the country mentioned in theCountry fieldis not Italy.

Data Object Editor
Depending on your class definition, you can see the computed data quality score(s) for a Data Object directly in its editor.
When filling new fields in the editor, the scores are updated only after reloading the Data Object.
If you change the rules for computing a score in your class definition, the Data Object must also be reloaded to update its score.
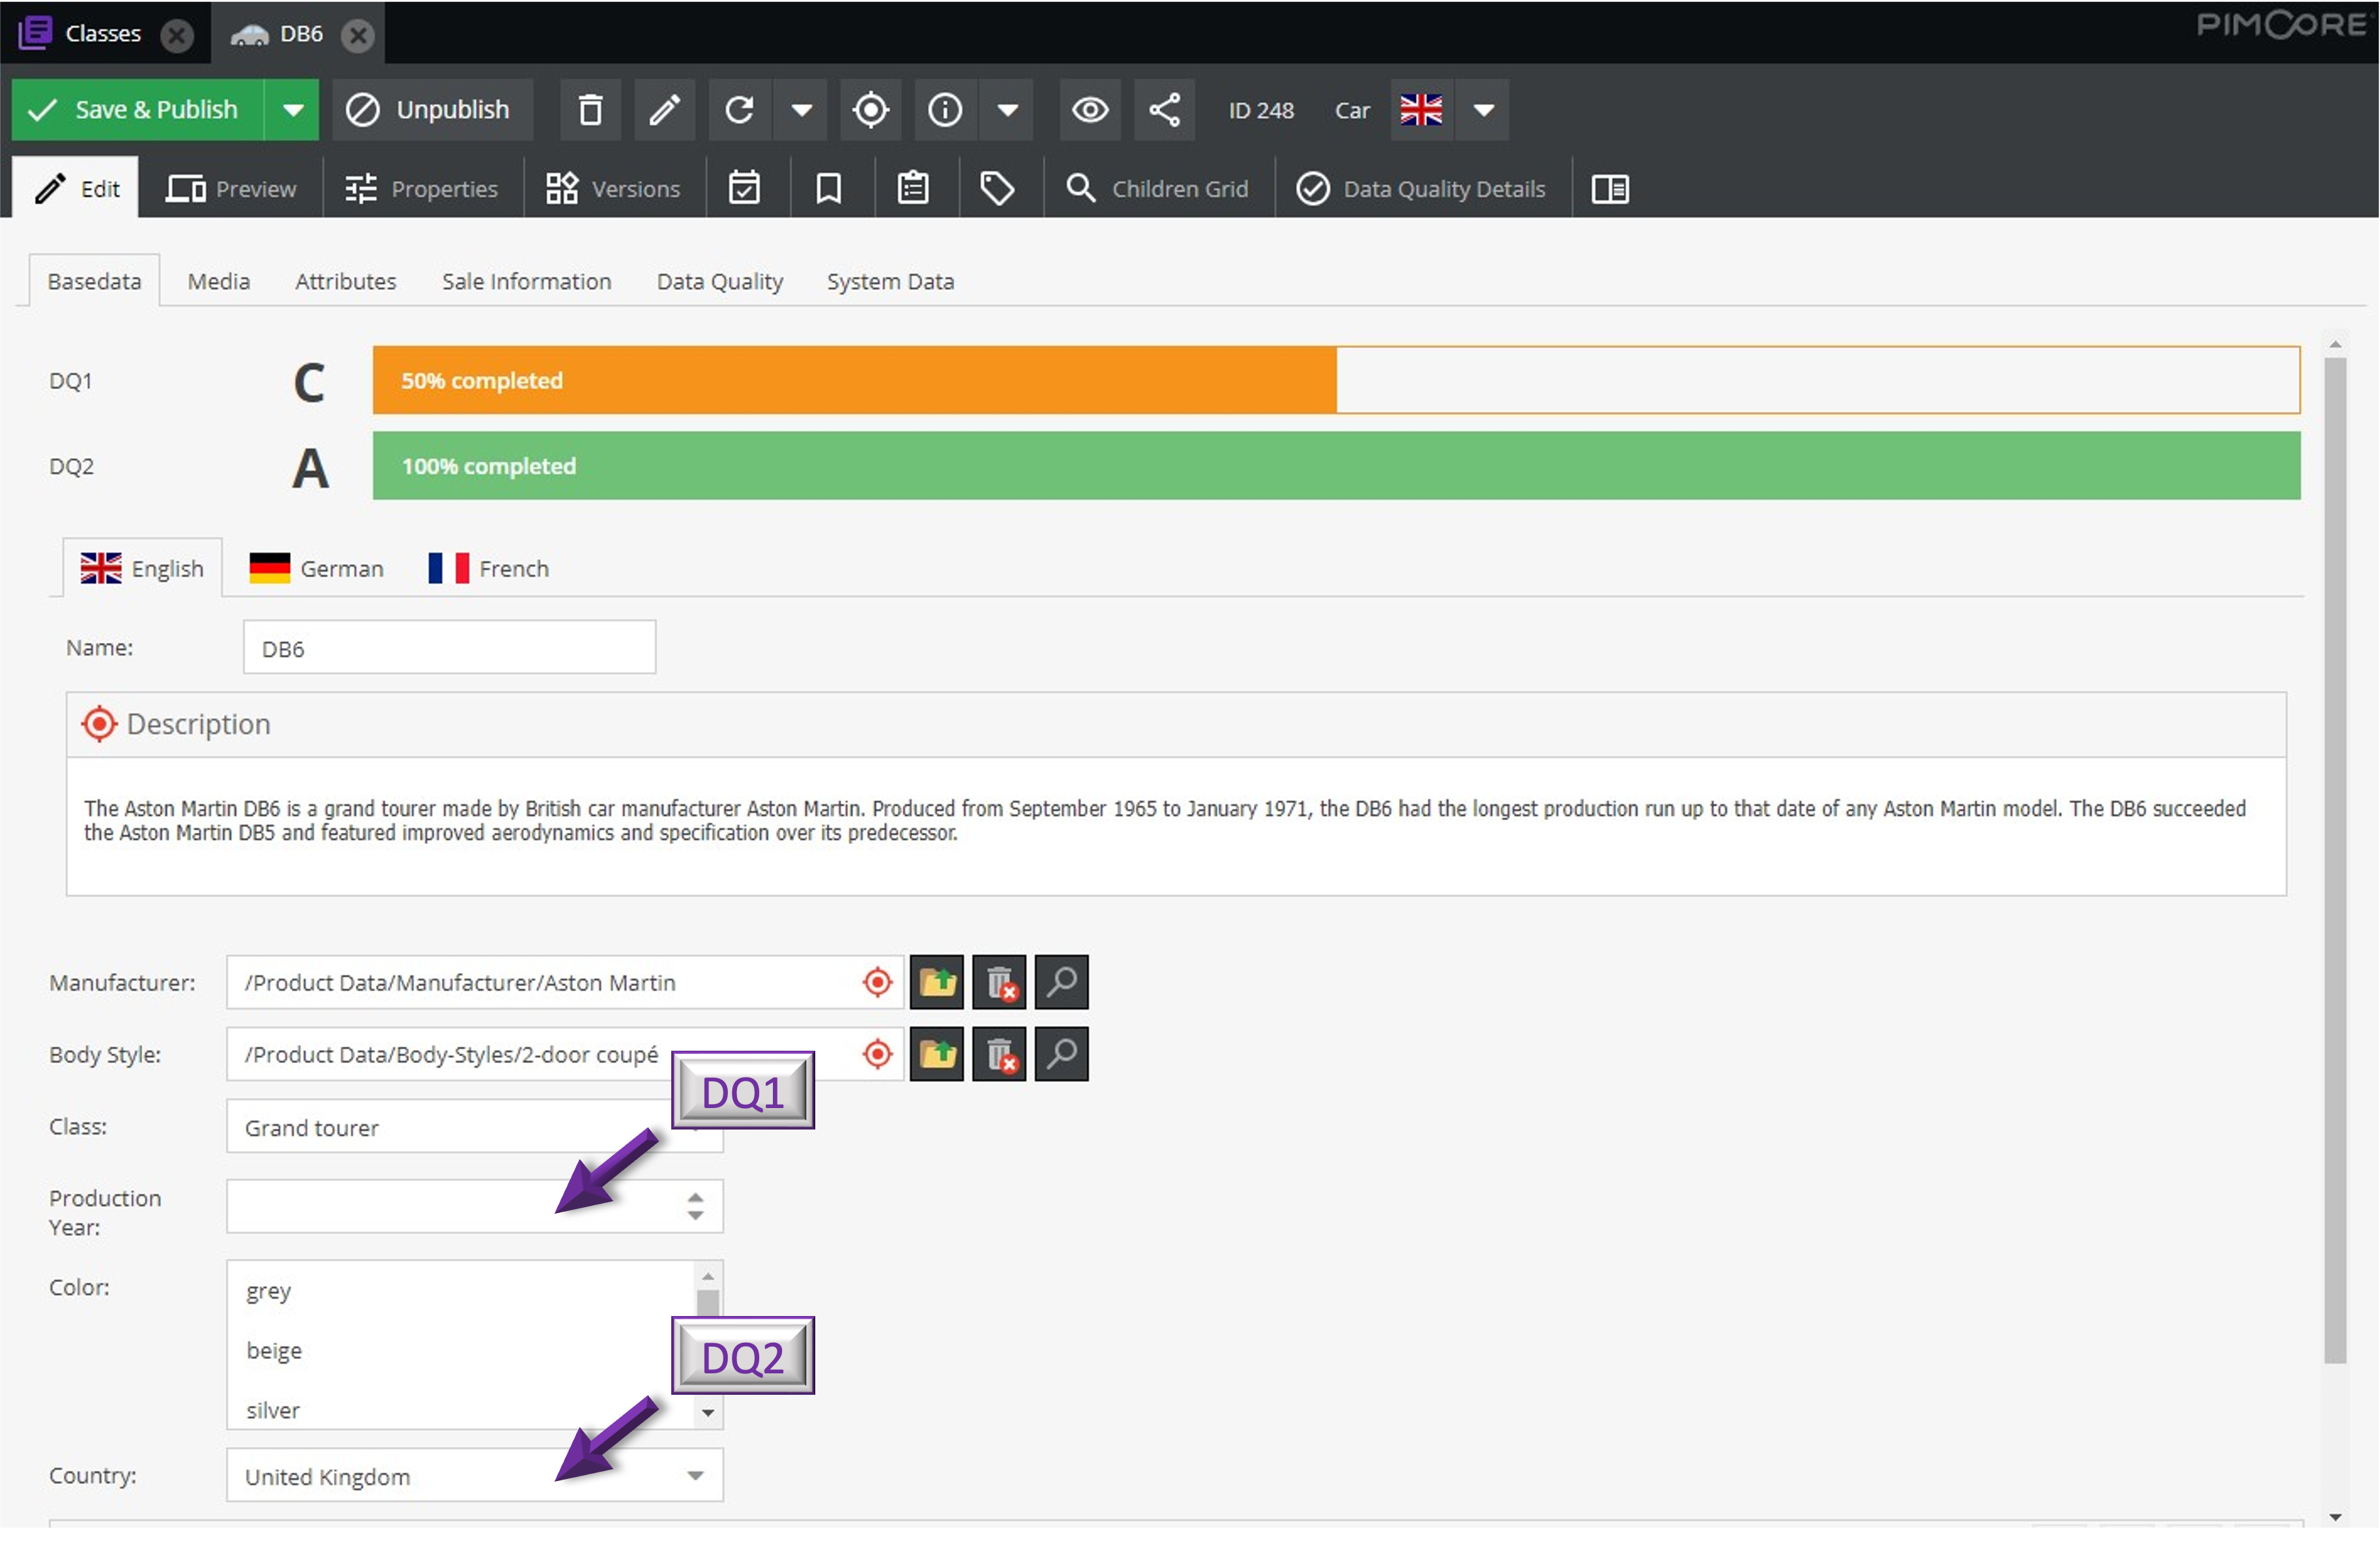

For this sample, the Data Object's Name and Description are filled, but not the Production Year field, which impacts the DQ1 data score. As the country mentioned in the Country field is not Italy, the Symfony Expression check is valid and the DQ2 score stays A.
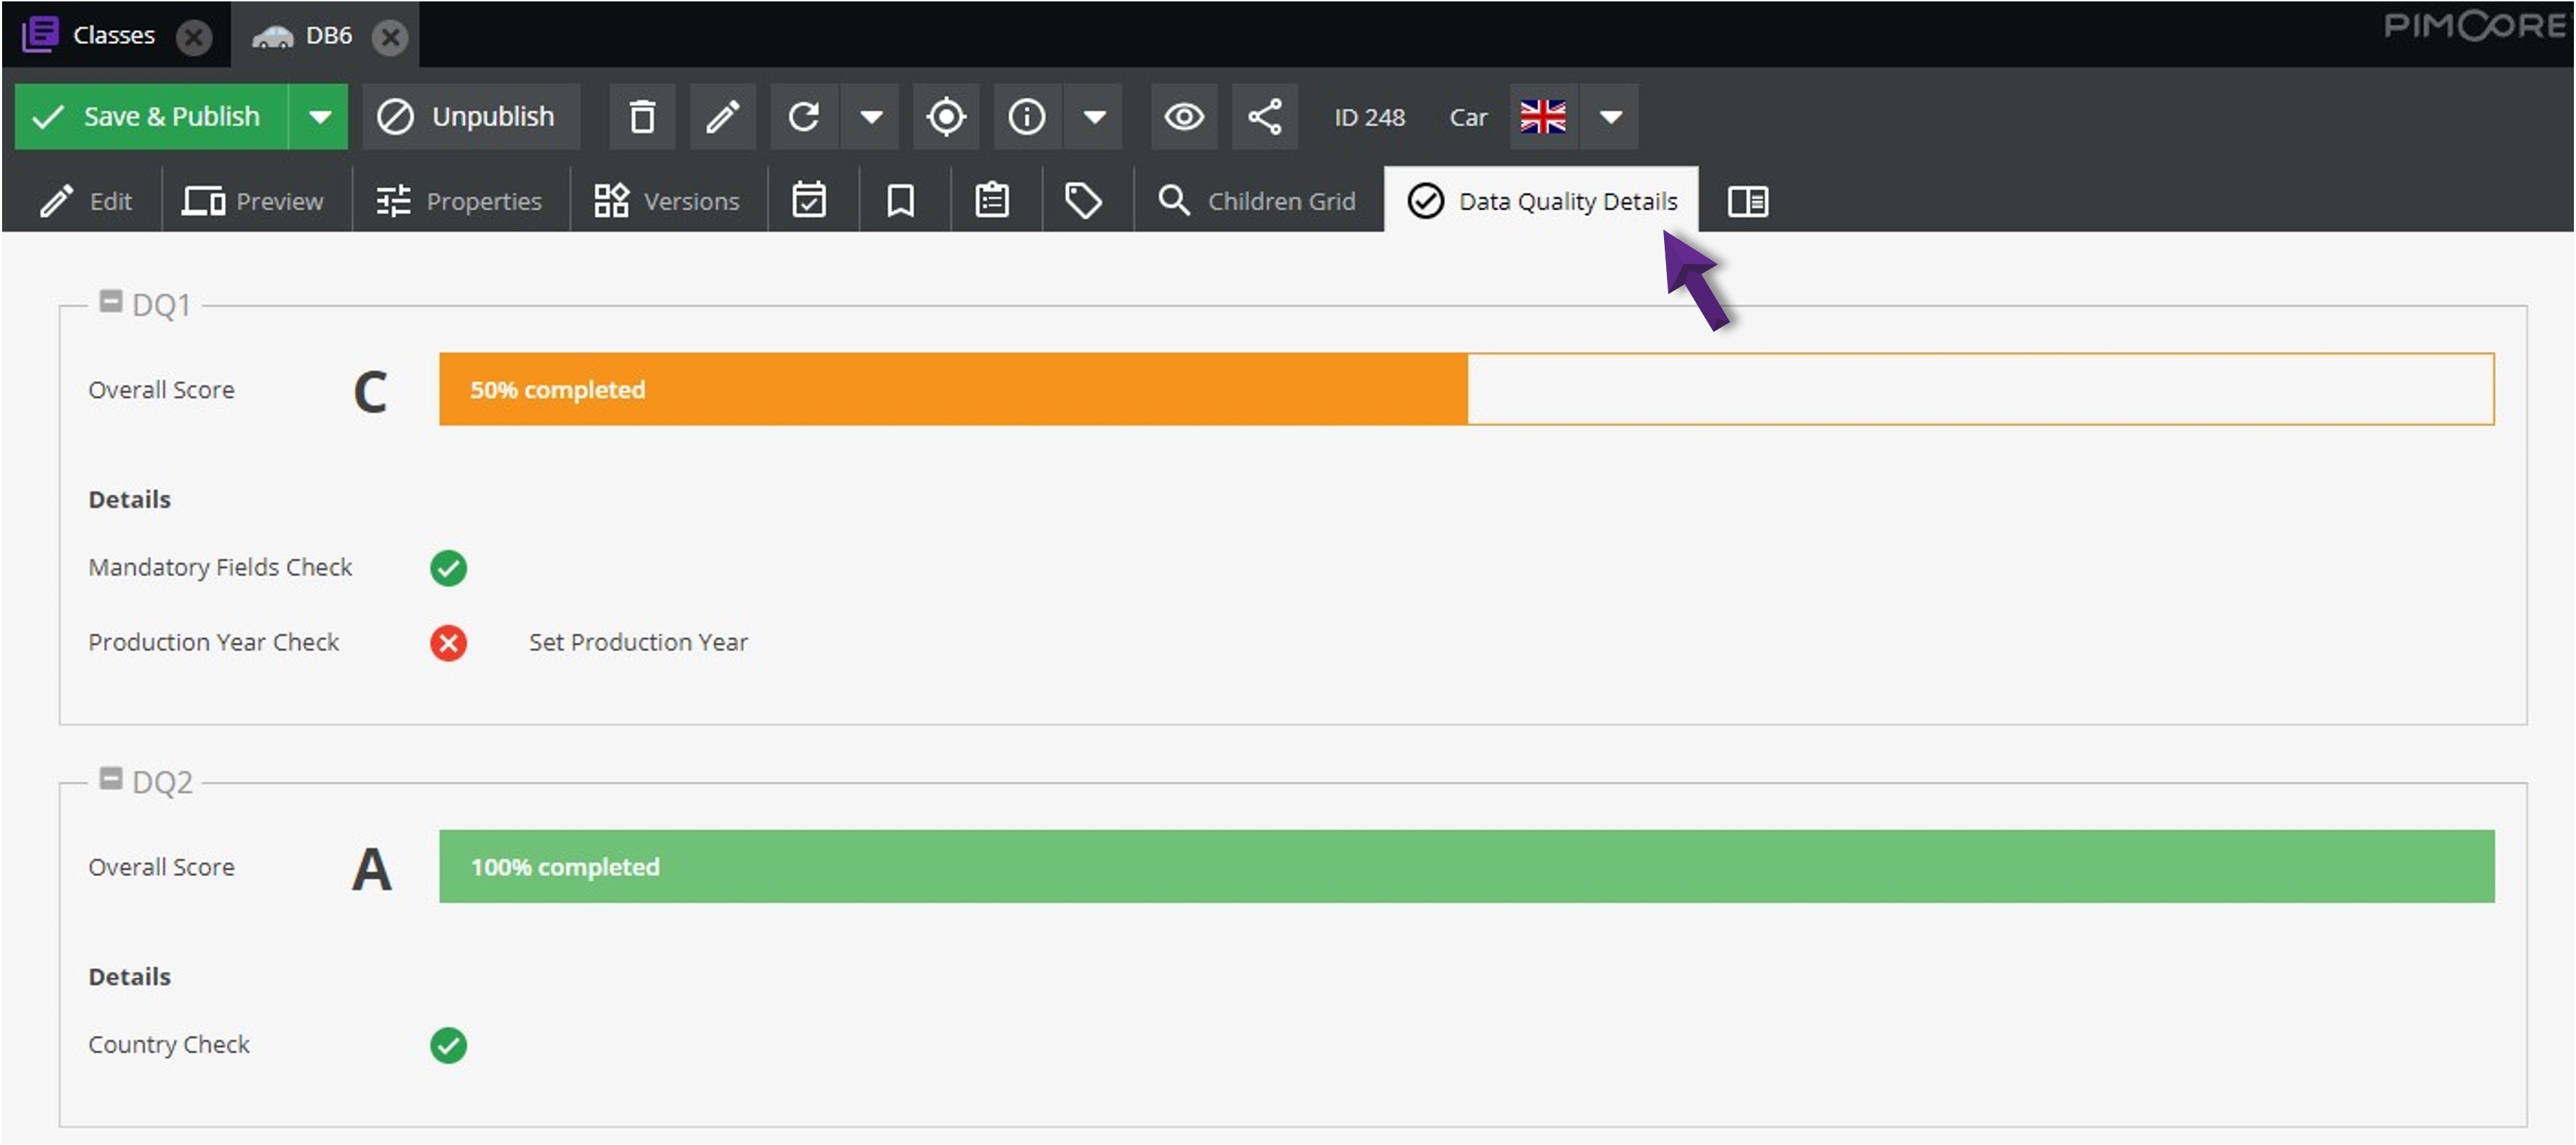
An additional Data Quality Details tab in the menu bar lists all the data quality scores computed for the current Data Object and details the filled and missing fields (for our sample, the Production Year field).

Data Object Grid
You can display the data quality scores in the Data Object grids by adding them (with a double-click on them) in the Grid Options.
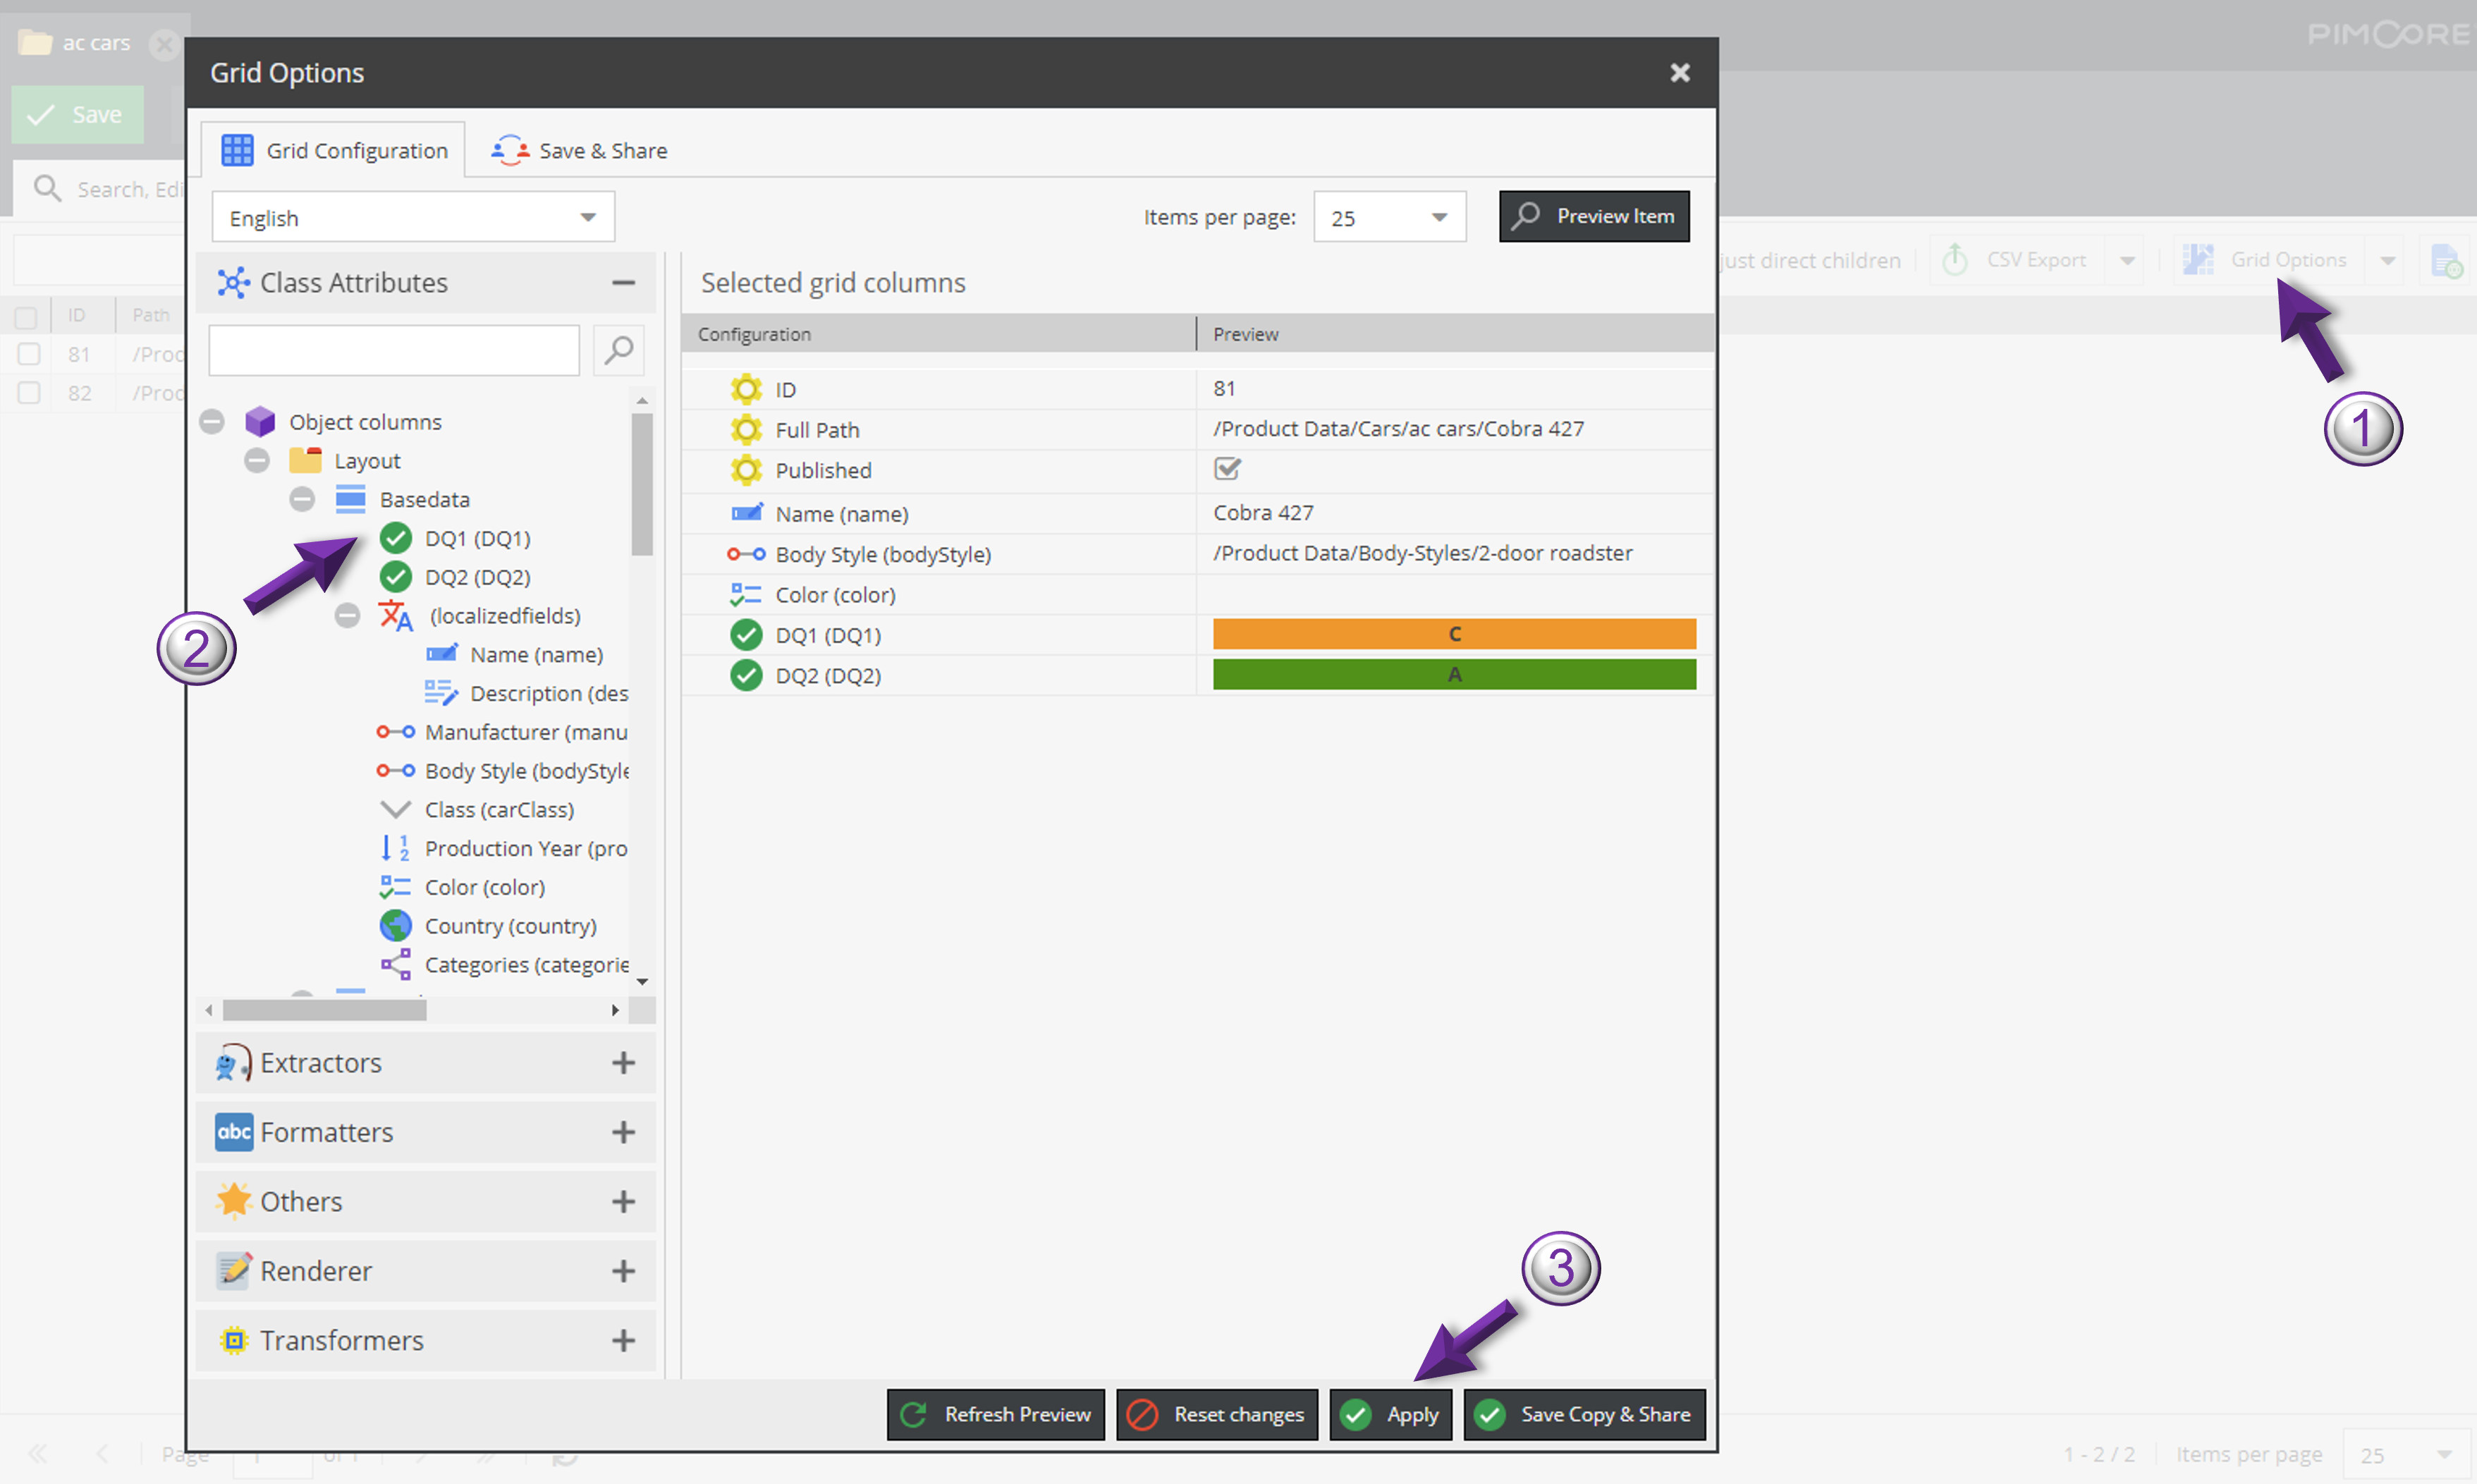

New read-only data quality score columns will be added to the grid. You can use these columns to sort or filter your Data Objects via a click on the top.
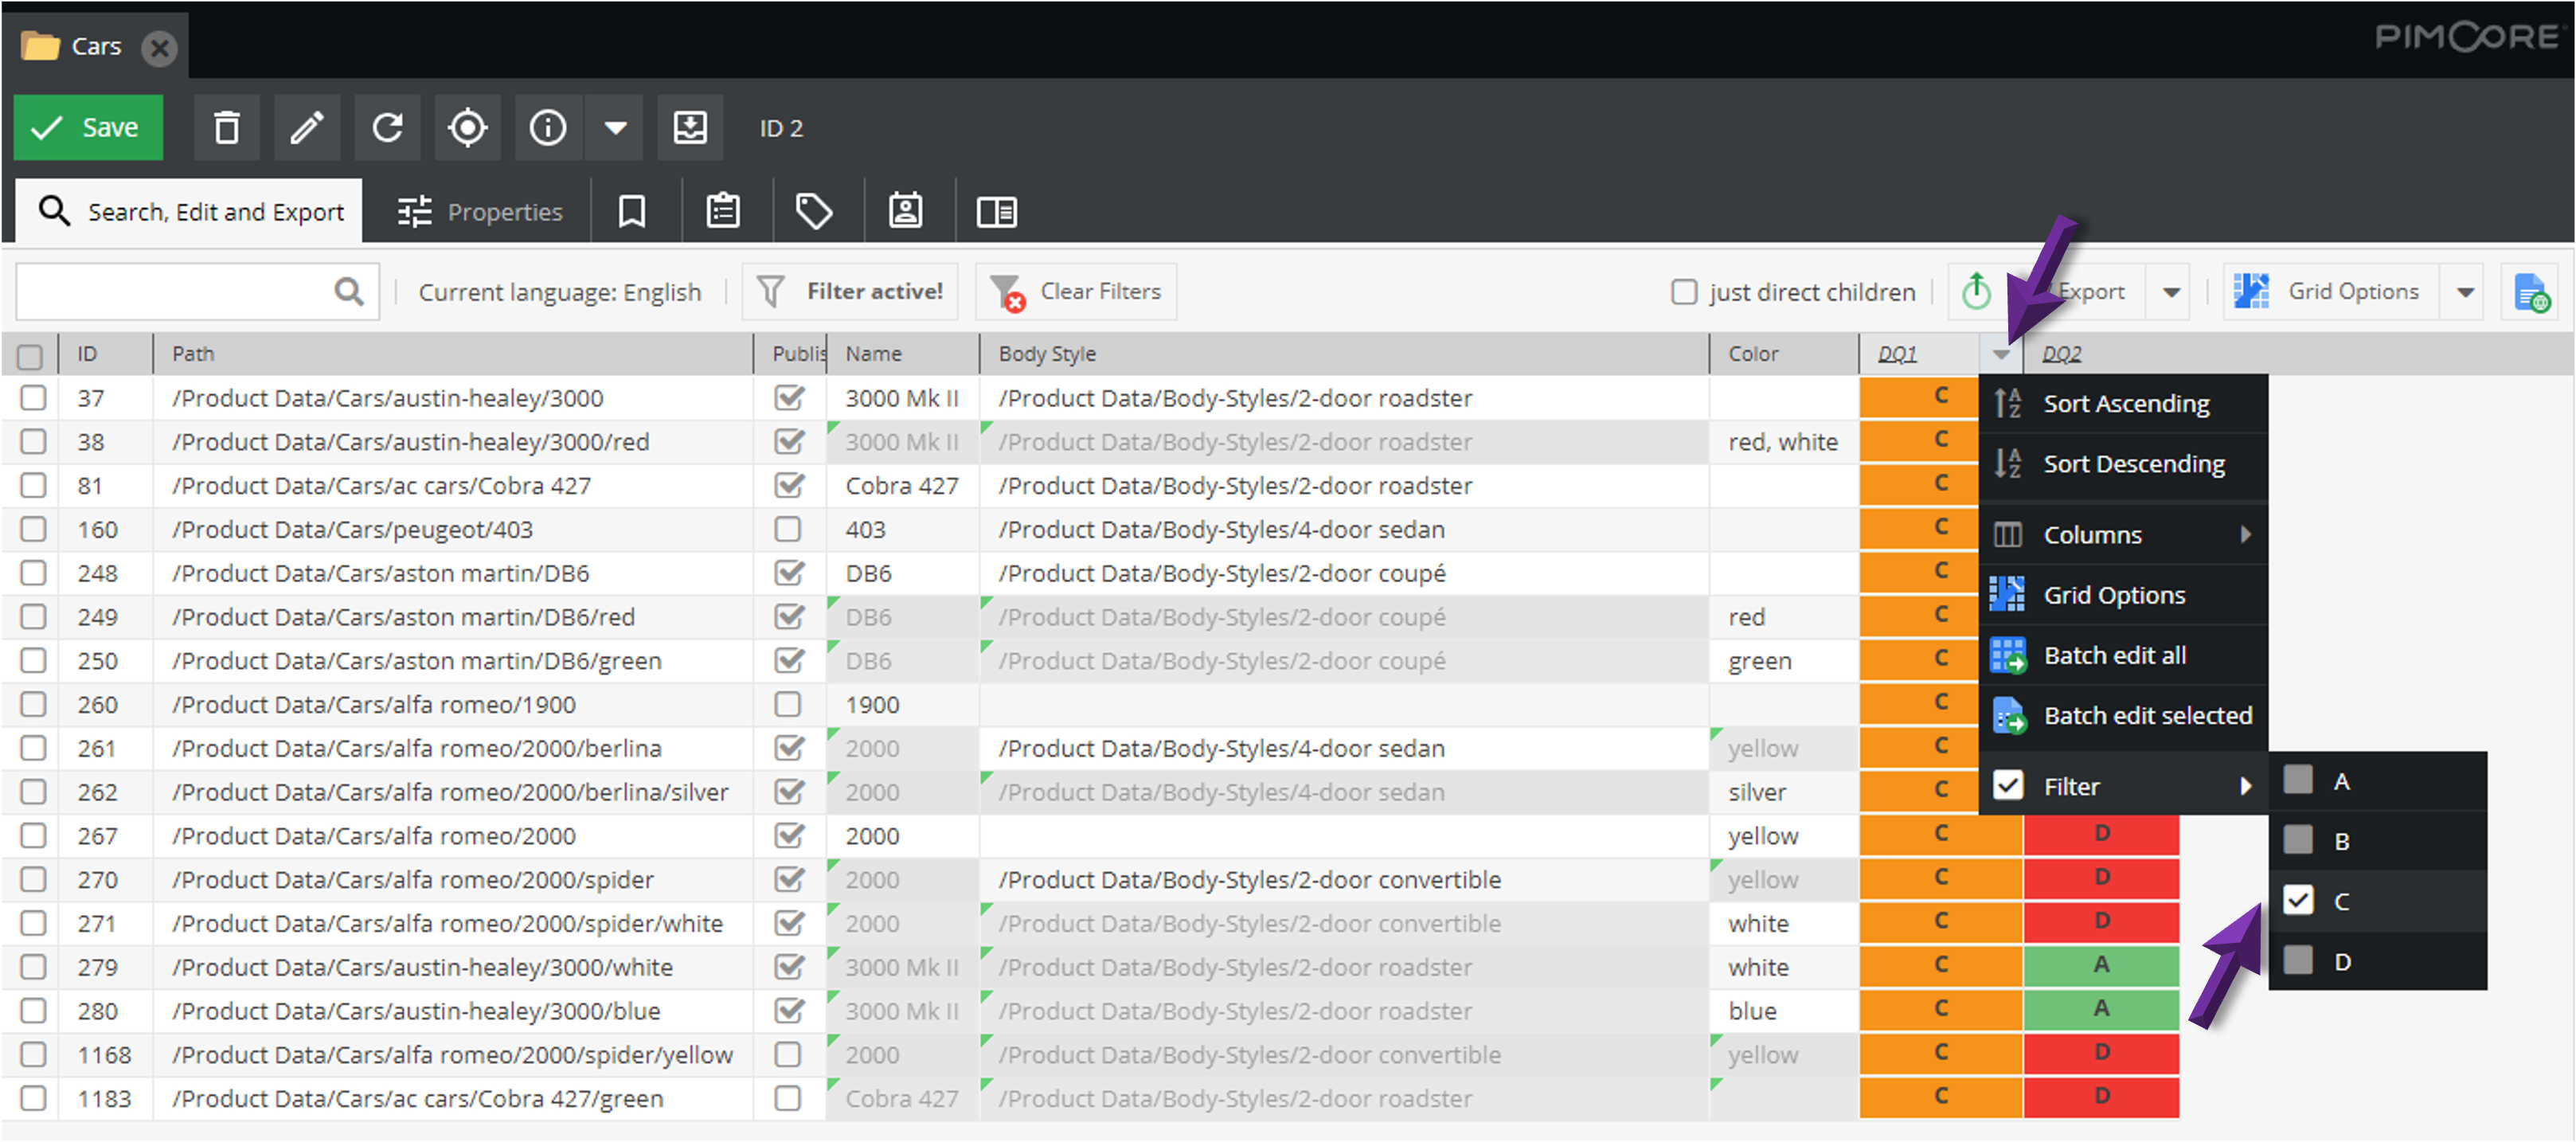

For CSV and XLSX exports, only the scores will be exported (without color).
Data Object Tree
If you select the Show in Tree option in your class definition, your available data quality scores (i.e. that meet the precondition - if any) will appear next to the Data Object name in the Data Objects tree.
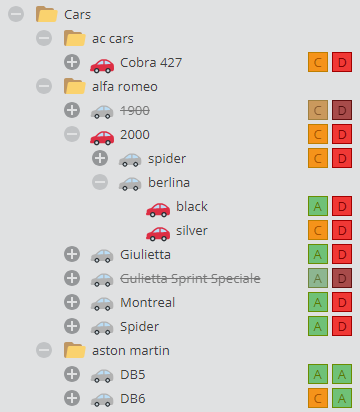

The scores for unpublished Data Objects are displayed with a shadow layer (see for example the yellow car in the sample above). You can style the score badges using CSS classes as explain in the Customization section.
If you update the rules for computing the scores in your class definition, you must reload the tree to display the right scores (click the Refresh option in the context menu).