Workflow Reporting
Depending on the marking store of workflows, different ways of Workflow Reporting are available. For details see marking store docs.
Using state_table and Custom Reports
You can easily use the custom reports to make workflow place reporting, filtering, exporting and directly open related elements. This way, you can follow and monitor workflows and the progress of document, asset and object.
Create a custom report for objects
First, you just have to create a new empty custom report, please see: custom reports
After creating it, you can configure it like this for the Source Definition, Column Configuration and Chart Settings:
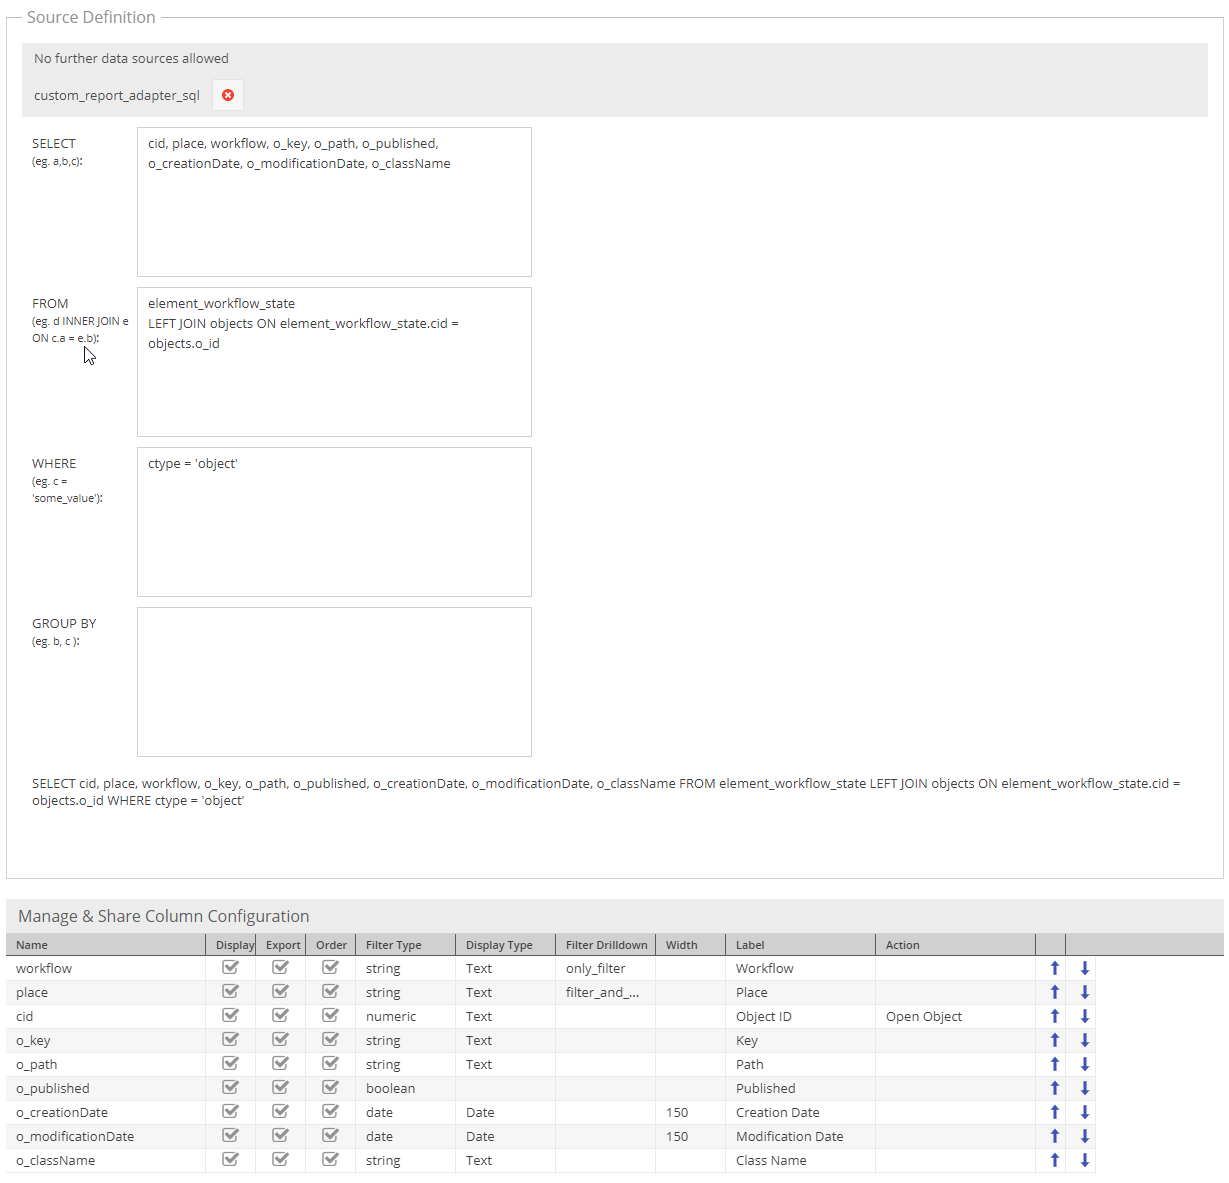
Save it and you are ready to use it! You can filter globally by state and status, order and filter the columns and export results
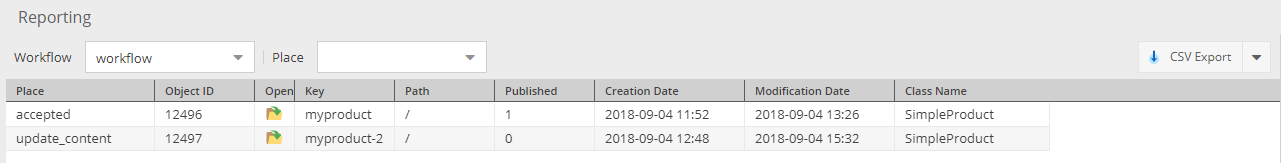
Here is an example of rendered workflow custom report:
Using single_state, data_object_multiple_state and data_object_splitted_state together with Object Grid
Since single_state (and others) stores the place information into data object attributes, Pimcore default
object grids can be used to do workflow reporting on Pimcore Objects.
Just create a corresponding grid configuration and use default filtering and sorting functionality.
Additionally extensions like Advanced Object Search can be used to create saved searches with predefined filters.